This post is part of the serie Using Custom Reports in TFS. The posts are more or less built on top of each other. Please read the earlier posts for a better understanding.
Earlier in this serie:
What tools can I use to present some data?
When you say custom reports the first thing that comes to mind is SQL Server Reporting Services (SSRS). This is true for most of the “complex” reports you see, but there are more possibilities.
In this post I will describe the different tools that you can use to extract data from your TFS server.
Work Item Queries and Excel
That seems obvious but Work Item Queries can provide valuable information that is sometimes hard to find in the TFS Warehouse. Another big advantage is. People do not need reader rights on your FS Warehouse database. If you have rights to execute queries, you can use this method. No additional settings needed.
The kind of information that you can use Work Item queries for.
- How many product backlog items are in a specific state?
- How many storypoints in a specific state?
- How many items are assigned to persons?
First I create a query in Visual Studio that contains data I like to visualize
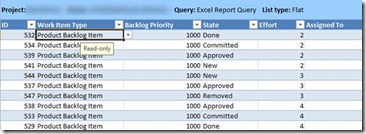
Then I open this particular query in Excel.
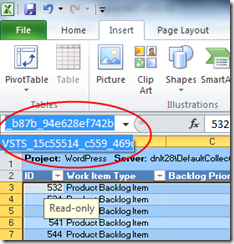
When this is done we can do some nice things. Select the TFS generated table by selecting it in the cell selector.
You will notice that only the content part is selected. This is good because our data can grow in excel. Copy the name from the cell selector (VSTS_15cxxxxx).
Open Sheet 2 from your excel workbook, and insert a Pivot Chart. Paste the copied table name in the range field or select it manually from Sheet 1. Make sure the VSTS_Guid is filled in.
Drag Fields to the pivot table like this and watch the results !
TFS Cube and Excel
We stay in Excel for this one as well. You can create awesome reports from the TFS Cube by using Excel. In order to do this there are 2 prerequisites.
- User must be added to the TFSWarehouseDataReader group on the Tfs_Analysis database

- Port for client connectivity to TFS Cube must be open (default 2384)
Create report in excel
- When you open excel, go to the Data Tab and create a connection to Analysis Services.

- Fill in servername of you analysis services and connect to a cube.

- The rest is pretty obvious. Choose pivot chart or table and start dragging like in the work item query example

Visual Studio 2008 BI Studio or ReportBuilder 3.0
There are 2 “advanced” tools that you can use to create real Reporting Services Reports. Visual Studio 2008 Business Intelligence Studio or ReportBuilder.
If you have SQL 2008 R2 you can use ReportBuilder 3.0 otherwise you are stuck with ReportBuilder 2.0
I really like ReportBuilder 3.0. Actually I like it better than VS 2008. Of course VS 2008 has some extra capabilities for checking in code or deploying multiple reports, but I ‘m wlling to pay that price.
For building purposes ReportBuilder 3.0 is more user friendly. The next posts in this serie will make use of ReportBuilder.
In my next post I will talk about setting up your data structures and environment.

 February 29, 2012


Trackbacks/Pingbacks
[…] What Tools can be used […]
[…] my previous posts on this blog, I really like reports. I wrote about how to customize them (here, here and here), how you should use them in your ALM implementation and how to use PowerPivot to your […]